
Wow, three of the top five game scores performances against the Cardinals in the postseason happened last October, and the Dodgers still managed to lose the series in six games.
Padilla was of course the pitching star in the 2009 NLDS , leading the Dodgers to the NLCS where he did not fare as well.
Player                  Date Series Gm#  Tm Opp  Rslt  IP H ER BB SO GSc
Jose Lima         2004-10-09   NLDS   3 LAD STL W 4-0 9.0 5  0  1  4  80
Zack Greinke      2013-10-11   NLCS   1 LAD STL L 2-3 8.0 4  2  1 10  75
Hyun-jin Ryu      2013-10-14   NLCS   3 LAD STL W 3-0 7.0 3  0  1  4  74
Vicente Padilla   2009-10-10   NLDS   3 LAD STL W 5-1 7.0 4  0  1  4  72
Clayton Kershaw   2013-10-12   NLCS   2 LAD STL L 0-1 6.0 2  0  1  5  70
Provided by Baseball-Reference.com: View Play Index Tool Used
Generated 9/29/2014.
I guess for context we should look at every start. Seeing Clayton Kershaw on the bottom is very very sad. At least three more games will get added this year.
Player                      Date Series Gm#   Rslt  IP  H ER BB SO GSc
Jose Lima             2004-10-09   NLDS   3  W 4-0 9.0  5  0  1  4  80
Zack Greinke          2013-10-11   NLCS   1  L 2-3 8.0  4  2  1 10  75
Hyun-jin Ryu          2013-10-14   NLCS   3  W 3-0 7.0  3  0  1  4  74
Vicente Padilla       2009-10-10   NLDS   3  W 5-1 7.0  4  0  1  4  72
Clayton Kershaw       2013-10-12   NLCS   2  L 0-1 6.0  2  0  1  5  70
Fernando Valenzuela   1985-10-14   NLCS   5  L 2-3 8.0  4  2  8  7  65
Orel Hershiser        1985-10-10   NLCS   2  W 8-2 9.0  8  2  5  4  62
Zack Greinke          2013-10-16   NLCS   5  W 6-4 7.0  6  2  1  4  60
Fernando Valenzuela   1985-10-09   NLCS   1  W 4-1 6.1  7  1  2  6  59
Clayton Kershaw       2009-10-08   NLDS   2  W 3-2 6.2  9  2  1  4  51
Ricky Nolasco         2013-10-15   NLCS   4  L 2-4 4.0  3  3  1  4  47
Orel Hershiser        1985-10-16   NLCS   6  L 5-7 6.1  9  4  1  1  39
Randy Wolf            2009-10-07   NLDS   1  W 5-3 3.2  6  2  5  2  38
Odalis Perez          2004-10-10   NLDS   4  L 2-6 2.1  3  2  5  0  38
Bob Welch             1985-10-12   NLCS   3  L 2-4 2.2  5  2  6  2  32
Jeff Weaver           2004-10-07   NLDS   2  L 3-8 4.2  8  6  2  4  26
Jerry Reuss           1985-10-13   NLCS   4 L 2-12 1.2  5  2  1  0  26
Odalis Perez          2004-10-05   NLDS   1  L 3-8 2.2  5  6  2  3  25
Clayton Kershaw       2013-10-18   NLCS   6  L 0-9 4.0 10  7  2  5  17
Provided by Baseball-Reference.com: View Play Index Tool Used
Generated 9/29/2014.
Three LAD have posted at least nine total bases against the Cardinals in postseason play. You have to drop the criteria all the way to six to get any additional players. Those two would be Milton Bradley and Mariano Duncan.
The three players who have at least nine total bases are:
It was the infamous Mickey Mouse Ear gesture by Adrian after he blasted a home run against the Cardinals at Dodger Stadium on Oct 16th that ignited the crowd.
Andre Ethier hit a double/triple/home run on Oct 10, 2009 in what had to be the biggest moment of his career, vaulting the Dodgers to a 5 – 1 game victory, and 3 – 0 series victory. Imagine, I wrote a whole story about his and neglected to mention Andre Ethier.
Lost in the Jose Lima game were the two solo home runs launched by Shawn Green to give the Dodgers the offense they needed.
Player                  Date Series Gm#  Tm Opp  Rslt PA R 2B 3B HR TB RBI
Adrian Gonzalez   2013-10-16   NLCS   5 LAD STL W 6-4  4 3  0  0  2  9   2
Andre Ethier      2009-10-10   NLDS   3 LAD STL W 5-1  5 2  1  1  1  9   2
Shawn Green       2004-10-09   NLDS   3 LAD STL W 4-0  4 2  0  0  2  9   2
Provided by Baseball-Reference.com: View Play Index Tool Used
Generated 9/29/2014.
When I first started posting about my teams results in the NFBC back in early August I had just cracked the top 20. At that time I was simply excited to be leading my league, and while hoping for a top 10 overall finish, never really believed it was possible. Yet, Kershaw/Kemp just kept doing their thing, and while some teams above me had Kershaw, no one had Matt Kemp so every time he delivered, he moved my team up the ladder. It was a crazy final day for me, and below is the recap.
Main Event Las Vegas March 22 League One Results
Moustacheball had the Main Event Las Vegas March 22 League One league title locked up several weeks ago, and ended up winning by 19 points, a substantial margin given the competition which included the 2013 NFBC $125,000 overall winner. The winner of each of the 30 leagues pulls home $6500
| Rank | Team | Batting Pts | Pitching Pts | Overall Pts |
| 1 | MoustacheBall | 66.0 | 61.0 | 127.0 |
| 2 | The Governor | 58.0 | 50.0 | 108.0 |
| 3 | Seeing Doubles | 48.5 | 57.5 | 106.0 |
| 4 | Zefurs || LV2 | 53.0 | 50.0 | 103.0 |
| 5 | Welcome to Stevieland | 50.5 | 46.0 | 96.5 |
| 6 | Tiger Slappy | 45.0 | 48.0 | 93.0 |
| 7 | CC’s Desperados | 47.0 | 40.5 | 87.5 |
| 8 | Ozville Flying Monkeys | 38.5 | 42.0 | 80.5 |
| 9 | DonnieBaseball ME | 36.0 | 43.0 | 79.0 |
| 10 | Four Headed Monster | 55.5 | 16.0 | 71.5 |
| 11 | Team Izenstark | 24.5 | 35.5 | 60.0 |
| 12 | Mudhens | 21.5 | 36.0 | 57.5 |
| 13 | Bama & Madcow | 23.5 | 33.5 | 57.0 |
| 14 | Team Cohan | 21.5 | 30.0 | 51.5 |
| 15 | Miami Mac | 11.0 | 11.0 | 22.0 |
2014 NFBC Overall Results:
Going into the last game, Moustacheball was in 7th place just a bit above 8th place. Some times you just need some luck. The team below had Wainwright ready to pitch but when the Pirates lost to the Reds, Wainwright sat out the last game which crushed that teams chance of taking my seventh place spot. Cole Hamels came up big in his last start of the year to give a good start to my day, but I was still in seventh as the morning games finished, but now found myself just a few points behind 6th.
One swing of the bat by Matt Kemp and Moustacheball had pushed themselves into 6th place. Now it was simply watching and hoping the lead would hold up. Most players were sitting out Sunday so very little action was happening in the afternoon games, and when the dust had settled on the 2014 season, the Moustacheball team had secured 6th place, and another $5,000 by 1 point.
I had paid over 250 FAAB dollars for Mookie Betts and in Sept he proved to be worth every penny, but it was Clayton Kershaw who pitched this team into the money.
I know it sounds strange to be excited about a 6th place finish but when it is 6th place out of 420 teams, I don’t feel wrong in feeling great about the season. I played against the best roto players in this country and more than held my own. Every roto site from http://www.baseballhq.com to http://www.rotowire.com has multiple teams in this competition.
Finishing sixth won’t change my life, but it does give what I do some validation.
It is easy to look back at the draft and see which move was the move that could have changed everything. With the 20th pick, I took Pirate pitching prospect Jameson Tallison. I had Dee Gordon on my list but figured I could get him with the next pick. The very next team picked Dee Gordon. I only had 186 points in the stolen base category, if I only added 50 steals that Dee would have brought me, that would have been 408 points. A swing of 222 points, and possibly the overall championship. Given he would have replaced Aaron Hill as my 2nd baseman, my BA would also have gone up quite a few points, as would have runs scored. The team that won, did have Dee Gordon. Kudos to him.
| Rank | Team | Owner | Overall Pts | AmountWon |
| 1 | Sons of Thunder 2014 | Greg Morgan, Dale Morgan | 3,643.0 | $125,000 |
| 2 | Broken Arms | Michael Makula | 3,521.5 | $30,000 |
| 3 | Cocktails and Dreams | Chad Schroeder | 3,501.5 | $20,000 |
| 4 | Belt Hangers | Chas Nelson | 3,467.5 | $10,000 |
| 5 | Da Giant Bums | Neal Moses, Charlie Casey | 3,450.5 | $7,500 |
| 6 | MoustacheBall | Meercat john | 3,433.5 | $5,000 |
| 7 | Sultans of Smack | Stephen Fiore | 3,432.0 | $3,000 |
| 8 | Hoss Cartwright | Kieran Lalonde, Lindy Hinkelman | 3,418.0 | $2,000 |
| 9 | Mudhens | Jon Stadtmueller | 3,408.5 | $1,750 |
| 10 | Cue the Duckboats ME 3/26 | Jason Duponte | 3,371.0 | $1,600 |

A few weeks ago we looked at the greatest single LAD efforts against the Rockies at Coors. Today we will look at the greatest single LAD efforts against the Rockies while playing at Dodger Stadium.
I was a little surprised that Mike Piazza did not make this list. Matt Kemp sits on top with the best, and second best games using total bases as the criteria. At least nine total bases was used in the search.
As for the hitting, Rafael Furcal, Andre Ethier, and Casey Blake each had a double and a single. Manny had two singles, Hudson had three hits, and Russell Martin got on base four times. But the player of the game was Matt Kemp, who went 3-5 with a double and two home runs, one of which was a grand slam. Kemp had 5 RBI’s.
Eric Stephen had the recap of the second best game against the Rockies at the Ravine.
Matt Kemp hit a pair of home runs, including one near the top of the left field pavilion, to lead the Dodgers to a 3-0 win over the Rockies on Saturday night at Dodger Stadium. The fourth straight win for the Dodgers pulled them to within two games of the Cardinals, who lost on Saturday to the Nationals. Kemp’s home run in the fourth inning, to left field, was estimated at 461 feet, which made it the longest hit by a Dodger this season. The previous long, per ESPN Home Run Tracker, was 454 feet, also hit by Kemp, on April 25 against Atlanta.
Paul LoDuca may not be on top of the total base leader-board but some would consider his six for six performance to be the best of the lot. For one thing is was six hits. For another thing they needed all six hits to beat the Rockies 11 -10 in a crazy game. His sixth hit put him on base in the 11th inning to score the winning run on a single by Shawn Green.
Player             Date  Tm Opp          Rslt PA 2B HR TB RBI
Matt Kemp          2009-04-19 LAD COL  W 14-2  5  1  2 10   5
Matt Kemp          2012-09-29 LAD COL   W 3-0  4  0  2  9   2
Paul Lo Duca       2001-05-28 LAD COL W 11-10  6  0  1  9   4
Andre Ethier       2009-04-18 LAD COL   W 9-5  5  0  2  8   4
Manny Ramirez      2009-04-18 LAD COL   W 9-5  4  0  2  8   2
Matt Kemp          2008-06-02 LAD COL   W 8-2  5  2  1  8   1
Jeff Reboulet      2001-07-28 LAD COL  W 10-6  5  2  1  8   4
Adrian Beltre      2000-09-17 LAD COL  W 12-6  4  0  2  8   3
Eric Karros     1999-07-22(2) LAD COL L 11-12  5  0  2  8   4
Provided by Baseball-Reference.com: View Play Index Tool Used
Generated 9/26/2014.

Clayton Kershaw put his final stamp on what was possibly one of the greatest Dodger regular season pitched performances ever, but that is a story for a another day.
As has been my trend since Clayton was 18 – 3, we have been tracking his incredible winning %. Going 21 – 3 has put Clayton on the top of the LA Dodger winning percentage leader-board for starting pitchers with at least 10 starts.
Player            W-L% GS Year  W L    IP BB  SO  ERA ERA+
Clayton Kershaw   .875 27 2014 21 3 198.1 31 239 1.77  197
Orel Hershiser    .864 34 1985 19 3 239.2 68 157 2.03  171
Sandy Koufax      .833 40 1963 25 5 311.0 58 306 1.88  159
Tommy John        .813 22 1974 13 3 153.0 42  78 2.59  132
Clayton Kershaw   .808 33 2011 21 5 233.1 54 248 2.28  161
Brad Penny        .800 33 2007 16 4 208.0 73 135 3.03  147
Rick Rhoden       .800 26 1976 12 3 181.0 53  77 2.98  113
Provided by Baseball-Reference.com: View Play Index Tool Used
Generated 9/25/2014.
What I love even more is the Dodger winning % in games he started. Clayton was only able to start 27 games because he missed a month, but the team still won 23 of his 27 starts. The Dodgers only lost one Kershaw start after May 28th. One. And that one loss was a complete game 2 – 3 decision.
So
27 starts
23 team victories
21 Kershaw victories
Only one thing stands between Clayton Kershaw the greatest regular season pitcher of the 21st century and legend.
A world series
Make it happen
Sometimes you need a nudge to get off your ass and yesterday Joe Benardello harangued me enough over at truebluela about going to the game last night, that I finally scored a ticket and made the journey.
Thank God for Joe, because that was one hell of a clinching game. I’ve been to three now this century (I can’t remember the previous century), and each one will hopefully stay stored in the databanks.
While everyone wanted the clinching game, I was more interested in Clayton ending the season at 21 – 3 because I knew the pennant was inevitable but 21 – 3 is historic. It took me a while to get on the Kershaw MVP bandwagon that started over six weeks ago, simply because he’s a pitcher, but this year Clayton Kershaw is Cy Young, MVP, and hell give him the Hank Aaron trophy to boot.
This game had all the flavors:
- Clayton hitting a triple to tie the game
- Dee Gordon swinging at the 1st pitch after his pitcher had hit a triple. I might have been swearing at Dee.
- Clayton doing the snag behind his back with a runner at 3rd when the game was tight. Might have been the best play you will ever see a pitcher complete in a clutch situation
- Puig simply blowing our minds with his throw from CF to 3rd, that cut short, and basically slit the Giants throat for the evening. Throws like that, that you see live, remain forever. The emotional jolt I simply can’t adequately describe.
- Puig giving the Dodgers the lead with the shot to RF
- The eighth inning that would never end as every Dodger came up big
But best of all, it had my Dodger fans with me, and that made it the sweetest taste of all.

This usherette was the best. Our group had commandeered the drinking/Standing area right behind home plate loge level. David Young and CtB scored it around 05:30. The usherette handled the box next to us, and the aisle. She was as into the game as any usherette we had ever witnessed. By the 9th we moved down the seats and spread out. She inexplicably plopped herself down next to Joe. I thought she was going to carry him home.

Going right from left, we had David Young, Bobby Down, CtB, Kelley Stephen and his talkative son.
Smiling Joe, backside of Craig, CtB, and David
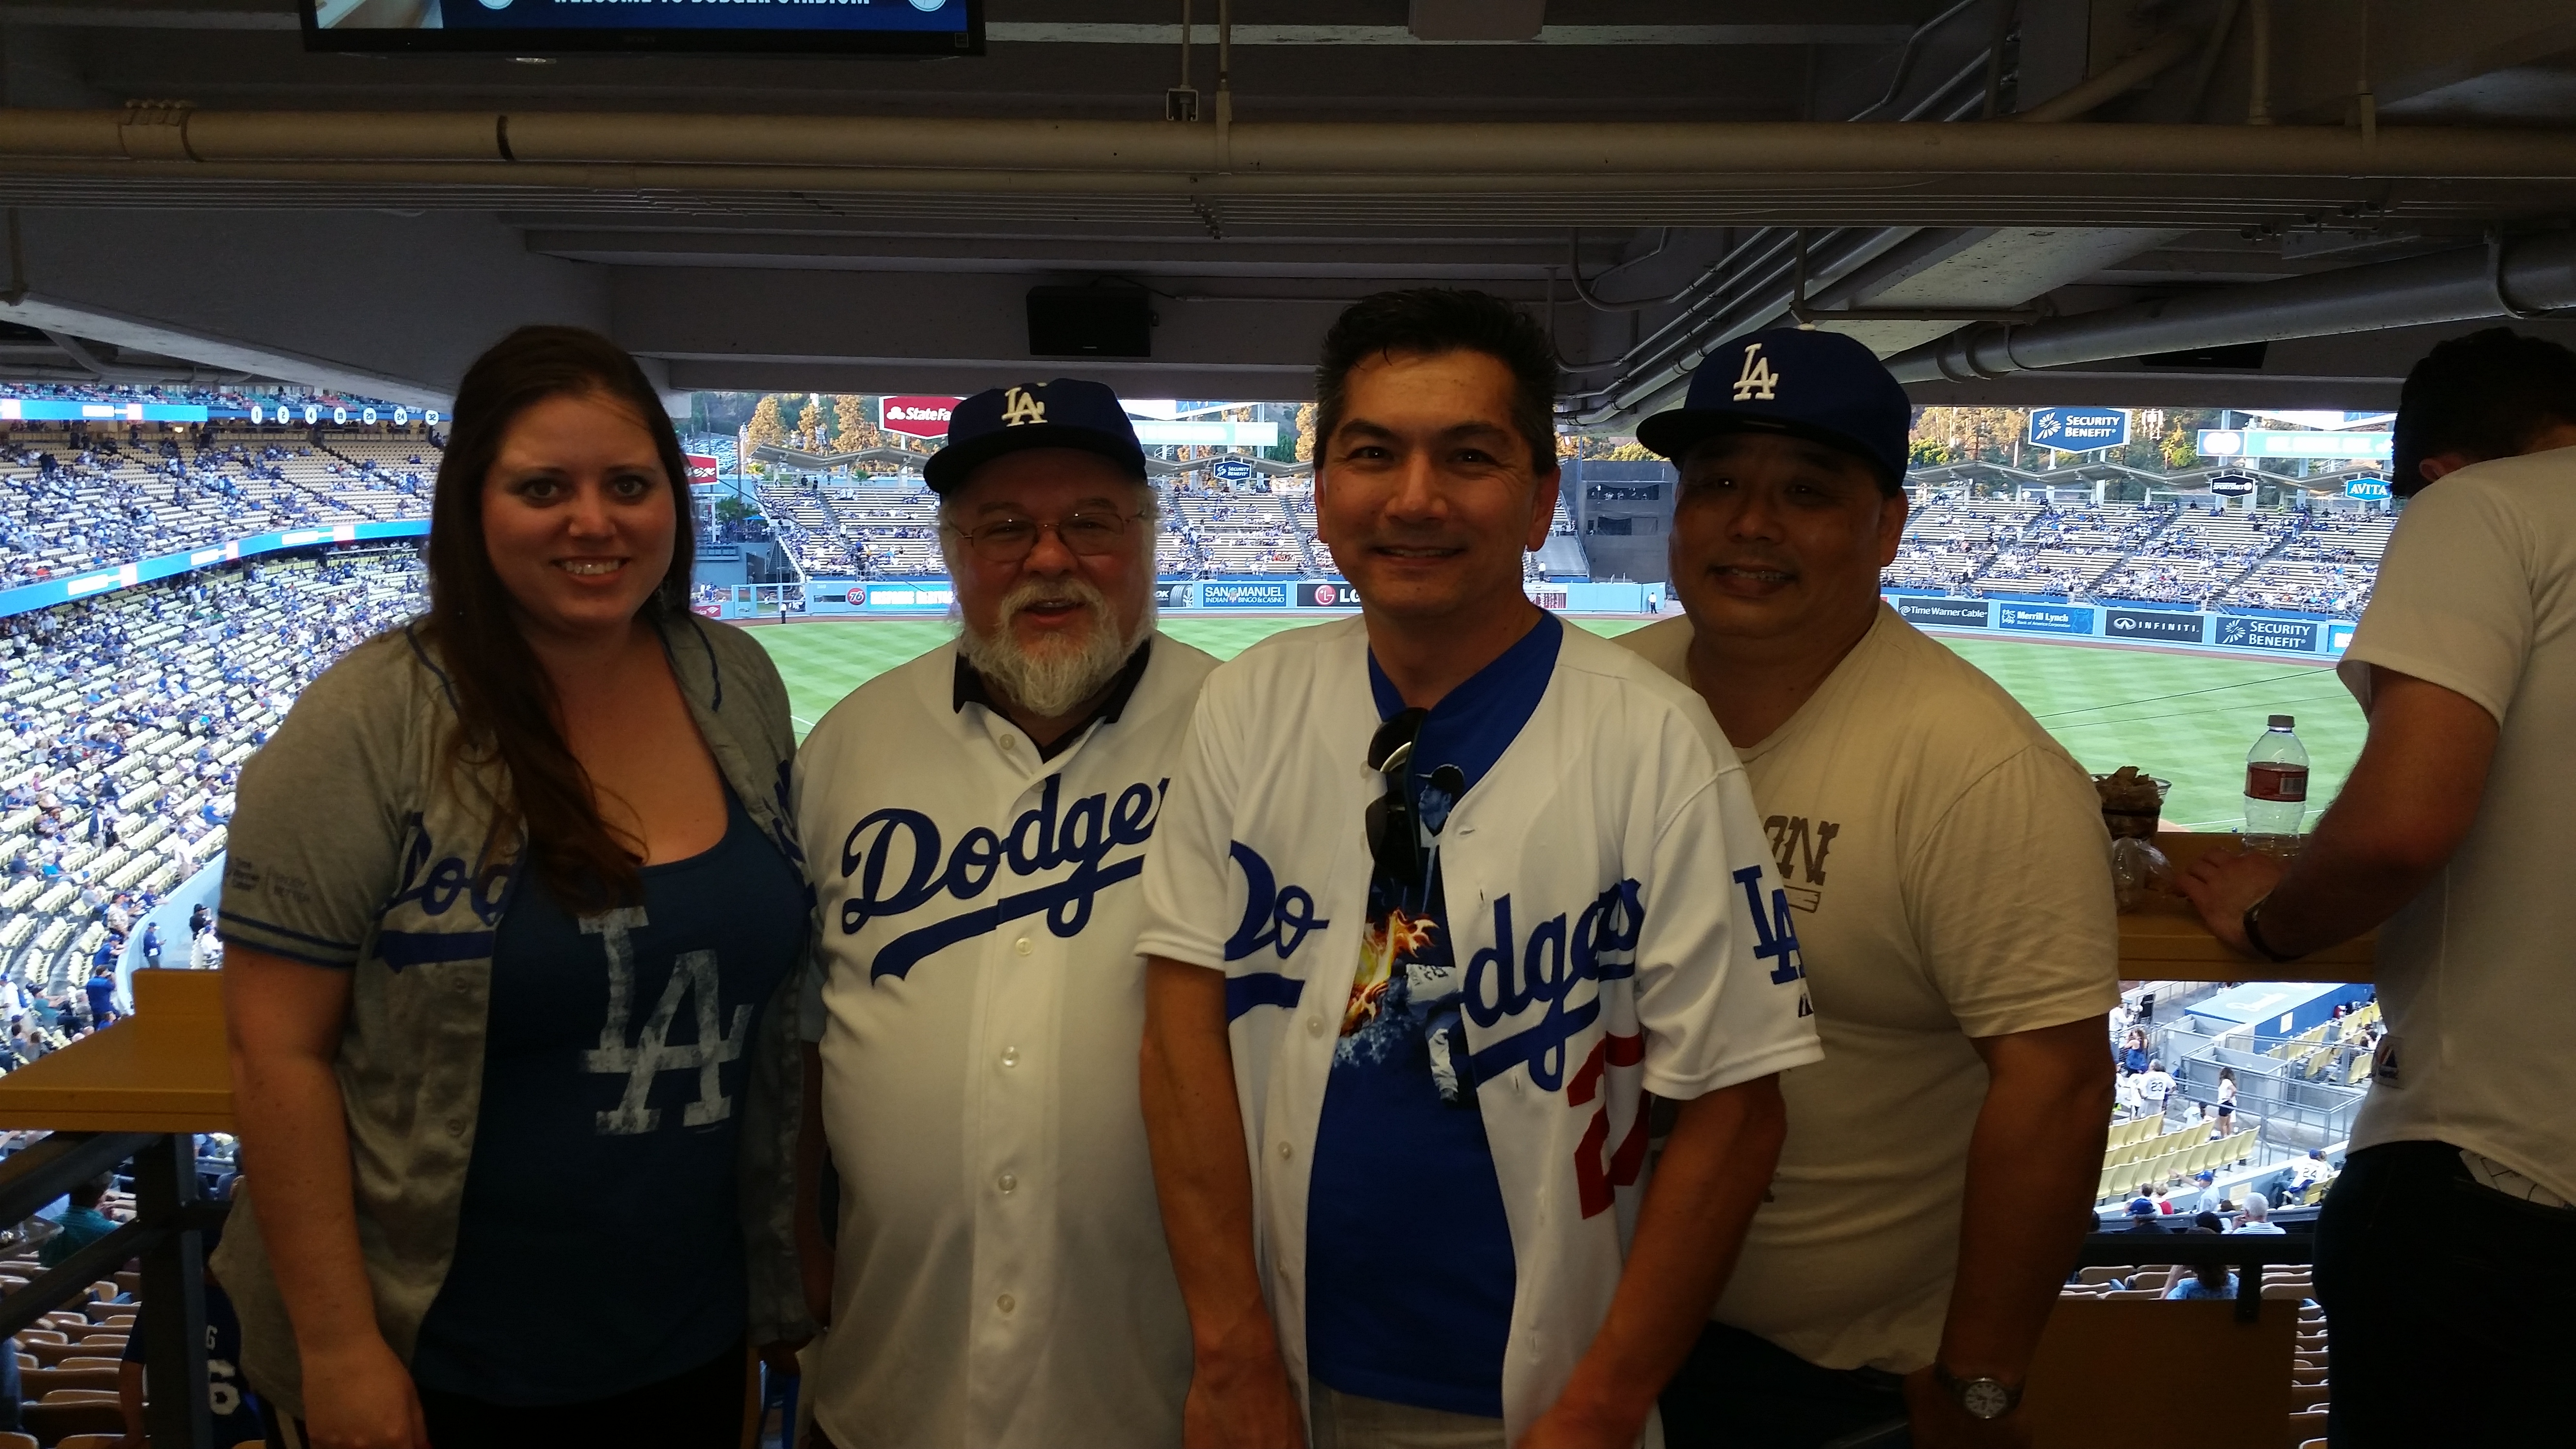
CtB, Berko, David, Craig
Kelly and his son spent the whole game us. Berko left before the game started, Bobby Bruin stopped by for a long while, and eventually Bobby Down showed up to finish the game. I may have broken my high-five record for a game.

All the Dodgers starting team, and key bench players are on fire, but leading the charge has been the starting outfield. All stats are courtesy of Fangraphs.com. Notice that three of them have a plus .600 slug %. Strangely enough, it is Carl Crawford with the highest Slug%. SVS has the strange stat of a lower OB than Average. This sure beats having to write about how no one can hit who plays Centerfield.
September Dodger Outfield Stats as of Sept 21st
| Outfielder | PA | Hits | XBH | HR | Avg | OBP | Slug% |
| Matt Kemp | 73 | 24 | 12 | 7 | 0.329 | 0.369 | 0.685 |
| Yasiel Puig | 69 | 22 | 6 | 2 | 0.319 | 0.405 | 0.464 |
| Carl Crawford | 53 | 23 | 9 | 2 | 0.434 | 0.448 | 0.698 |
| Scott Van Slyke | 24 | 10 | 3 | 1 | 0.417 | 0.400 | 0.625 |
I guess facing the likes of the Rockie/Cub pitching staffs can do wonders for a teams statistics.

On Aug 20th, 1974 Davey Lopes had one of the all time great offensive games the LA Dodgers have ever produced from an infielder, when he accounted for fifteen total bases against the Cubs. Included in that total are three home runs and one double. With a score of 18 – 8 you can expect that everyone chipped in. Ron Cey and Willie Crawford both had four hits, while Steve Garvey drove in four runs. Jimmy Wynn had a perfect game doing what he always did, hit a home run and take a few walks.
It was strange to see Billy Grabarkewitz on this list from his 1970 season. Not because Billy didn’t have a great 1970 season but because most of his damage in 1970 came before the all-star game. Billy was hitting .341 at the all-star game, but hit just .232 afterward. Games like the one he had on Aug 14th had to be far and few between after the break. This is a great box score to look at if you love Dodger history. Maury Wills had five hits, and Bill Russell was playing RF. Combined, the old SS, and the future SS went eight for nine. Grabarkewitz who did play a lot of SS in 1970 was playing 3rd base.
Ron Cey had the large RBI game with seven, again in 1974. Looks like the Dodger infield beat the crap out of the Cubbies that year.
The Bull, Al Ferrera had two games of two home runs at Wrigley. That extra single is what got him on this leaderboard.
Player                        Date   Rslt AB R H 2B 3B HR TB RBI
Davey Lopes             1974-08-20 W 18-8  6 3 5  1  0  3 15   4
Billy Grabarkewitz      1970-08-14 W 13-9  4 3 3  0  1  2 11   2
Pedro Guerrero          1982-08-18  W 7-4  5 2 3  1  0  2 10   5
Roger Cedeno         1996-06-18(1)  W 9-6  5 1 4  2  0  1  9   4
Ron Cey                 1974-06-01 W 10-0  4 3 3  0  0  2  9   7
Willie Davis         1967-09-04(2)  W 8-6  5 3 4  0  1  1  9   2
Al Ferrara              1967-05-20 L 3-20  4 2 3  0  0  2  9   2
Al Ferrara              1966-06-07  W 8-6  5 2 3  0  0  2  9   2
Willie Davis            1962-04-26 W 12-5  5 2 3  0  0  2  9   2
Frank Howard            1961-04-29  W 9-4  4 2 3  0  0  2  9   6
Duke Snider             1960-05-29  W 4-0  4 2 3  0  0  2  9   4
Provided by Baseball-Reference.com: View Play Index Tool Used
Generated 9/19/2014.

Just in case you have also missed what Don Mattingly has missed, Adrian is what some might call a platoon player in waiting. Meaning, that his manager still remembers when he could hit both sides of a pitcher, however the stats now say something has changed, and eventually the winds of change will be upon Adrian.
Or not, maybe this is just a one year anomaly. The last time Adrian had an OPS below .700 against LHP, was 2008, and he bounced back quite well. He was also only 26 not 32, so I’m not sure how much I’d be betting on 33 year old Adrian to rediscover the magic of hitting the MLB southpaw.
I’m only pointing this out on Sept 19th, 2014 because the postseason beckons and given that SVS or Juan Uribe (Turner at 3rd) offer alternatives to giving away at bats against LHP, it might be best if Donny put his best team on the diamond. Unless of course over the next 10 games, Adrian magically discovers how to hit LHP again, in which case you can use this for silly things bloggers have written fodder.
| Batting Against | AB | Hits | XBH | HR | Avg | OBP | Slug% |
| Right Handed | 409 | 125 | 52 | 21 | 0.306 | 0.362 | 0.535 |
| Left Handed | 151 | 30 | 10 | 2 | 0.199 | 0.262 | 0.291 |
Besides not being able to hit left hand pitching, Adrian has been a very streaky hitter in 2014. I’ve created these data points by using the Bref game logs and taking the high and low OPS. For example on May 1st Adrian’s OPS peaked at 1.043 and bottomed out on July 20th at .735.
Every hitter has streaks of good and bad, but Adrian this year seems to have taken those streaks to Hee Sop Choi levels.
| Date From and To | AtBats | Hits | XBH | HR | Avg | OBP | Slug% |
| 03/22 – 05/01 | 109 | 35 | 18 | 9 | 0.321 | 0.392 | 0.651 |
| 05/2 – 07/20 | 255 | 56 | 17 | 5 | 0.22 | 0.277 | 0.325 |
| 07/21 – 08/07 | 57 | 18 | 8 | 1 | 0.316 | 0.385 | 0.491 |
| 08/08 – 09/09 | 106 | 38 | 16 | 8 | 0.358 | 0.403 | 0.66 |
| 09/10 – 09/18 | 33 | 8 | 3 | 0 | 0.242 | 0.286 | 0.333 |

Fernando started the season with five shutouts in his first seven major league starts. Basically every game Fernando started he was rewriting history during Fernandomania.
What Fernando did in his first 8 starts was a streak for the ages: 8 wins, 7 complete games, 5 shutouts and 4 earned runs surrendered in his first 72 innings. In streaks of over 80 innings, only Bob Gibson’s 3 earned runs in 103 innings In 1968 was better than Fernando’s 4 earned runs in 89 2⁄3 innings dating back to 1980
His fifth shutout came on May 8th, he would not pitch his sixth shutout until Aug 16th. Of course the MLBP strike shut him down for two months (June 12th – Aug 10th). From Aug 16th – Sept 17th Fernando would throw three shutouts as readied himself for his historic 1981 postseason run.
These eight shutouts still rank as the best in baseball for a rookie. Note the age compared to others who are on the leaderboard. Many rookies have thrown five shutouts, I’ve included only the Dodger pitchers who accomplished the feat. You can also note the name of Don Newcombe. Newcombe in his Rookie season also won the ROY and Cy Young award, just like Fernando. Strange to see they were the only two pitchers to even win ROY on this leaderboard.
Player                          SHO Year Age  Tm    IP   H  ER  SO  ERA  FIP ERA+
Fernando Valenzuela (RoY-1st)     8 1981  20 LAD 192.1 140  53 180 2.48 2.44  135
Reb Russell                       8 1913  24 CHW 316.2 250  67 122 1.90 2.68  154
Russ Ford                         8 1910  27 NYY 299.2 194  55 209 1.65 1.88  160
Jerry Koosman (RoY-2nd)           7 1968  25 NYM 263.2 221  61 178 2.08 2.70  145
Pete Alexander                    7 1911  24 PHI 367.0 285 105 227 2.57 2.83  133
Harry Krause                      7 1909  20 PHA 213.0 151  33 139 1.39 1.91  174
George McQuillan                  7 1908  23 PHI 359.2 263  61 114 1.53 2.31  157
Irv Young                         7 1905  27 BSN 378.0 337 122 156 2.90 2.53  106
Harvey Haddix (RoY-2nd)           6 1953  27 STL 253.0 220  86 163 3.06 3.40  139
Gene Bearden (RoY-2nd)            6 1948  27 CLE 229.2 187  62  80 2.43 3.89  168
Fred Glade                        6 1904  28 SLB 289.0 248  73 156 2.27 2.17  110
Don Newcombe (RoY-1st)            5 1949  23 BRO 244.1 223  86 149 3.17 3.13  130
Dazzy Vance                       5 1922  31 BRO 245.2 259 101 134 3.70 3.64  111
Henry Schmidt                     5 1903  30 BRO 301.0 321 128  96 3.83 3.74   84
Provided by Baseball-Reference.com: View Play Index Tool Used
Generated 9/17/2014.
Here is the box score from Sept 17th, 1981 – a few notes:
- This was the last year of the Garvey/Lopes/Russel/Cey infield but on this day Cey and Russel took the day off with Gary Weiss playing SS, and super utility player Derrel Thomas manning 3rd
- Fernando who also add the Silver Slugger to his trophy mantle that year, got a hit and drove in one of the two runs. Strangely enough it was an infield hit to second and scored the slowest runner in baseball Mike Scoscia who was on 3rd base.
- This win would put the Dodgers up by two games, but they would lose the next five and end the year four games out. But it did not matter, because they won the first half of the strike shortened season and Reds could only claim to have the best record but no invitation to dance.

")


